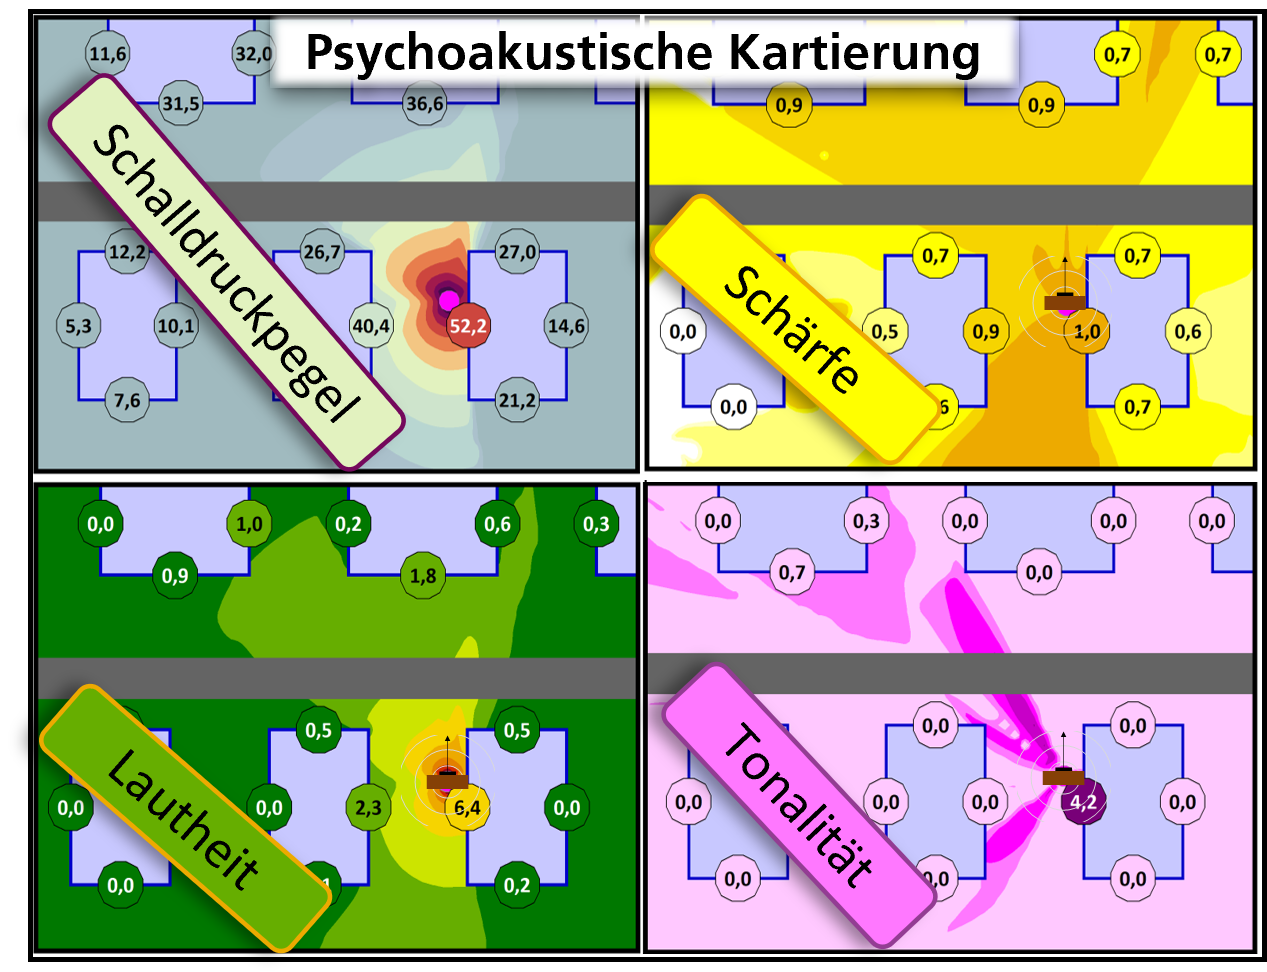
Noise maps depict ambient noise on cadastral maps. They are a tool used in area-related noise immission control and serve to visualize noise immissions in areas affected by noise. The decisive evaluation parameter, the sound pressure level, is demonstrably only suitable to a limited extent for evaluating actual noise pollution. Psychoacoustic parameters, such as loudness, sharpness and tonality, make it possible to describe the actually perceived noise more accurately and objectively with numerical values. DIN ISO 12913 recommends (among other things) additional psychoacoustic mapping for the perception-related evaluation and development of sound immission of existing as well as future soundscapes.
Psychoacoustic mapping as a tool for predicting perceived sound immission
Project goals
The initial goal of the project is to implement psychoacoustic mapping software in cooperation with SoundPLAN GmbH. Once this has been accomplished, the main focus will be on further research and development scopes as well as practical application.
Potential applications include (urban) courtyards with a soundscape of noises from vehicles, fans, recreation activities, waste disposal and construction sites.
Further use cases concern the field of electric mobility. These include the new engine noise due to the modified drive as well as the additional AVAS acoustic vehicle alert system. Additional noise sources arise during the charging process, caused by fans and compressors installed in the vehicle, especially when high ambient and component temperatures require the battery to be cooled.
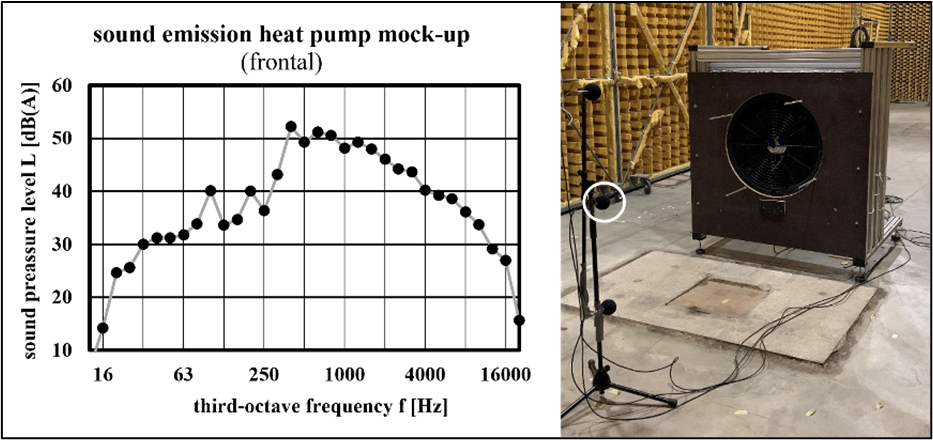
The use of sustainable technologies in the context of climate change is also often met with resistance from the general public. Noise emanating from modern renewable energy generation systems, such as heat pumps and wind turbines, is one example of this. This noise frequently has a disturbing effect on humans as well as on nature. Psychoacoustic mapping makes it possible to predict noise emissions from such systems on a more perceptual basis than before and to identify optimized installation sites and specific noise abatement measures.
Current project status
In the first development phase, the chosen approach for psychoacoustic mapping exploits the correlation between psychoacoustic parameters and the sound pressure level. In established software solutions such as SoundPLANnoise®, sound propagation in third-octave frequency-dependent sound pressure levels can be calculated as standard. From this, the psychoacoustic parameters of loudness according to DIN ISO 532-1 and sharpness according to DIN EN ISO 45692 (Aures) are calculated. Initial indications of tonal noise components are also derived from these third-octave frequency bands according to ISO 1996-2 (Annex K).
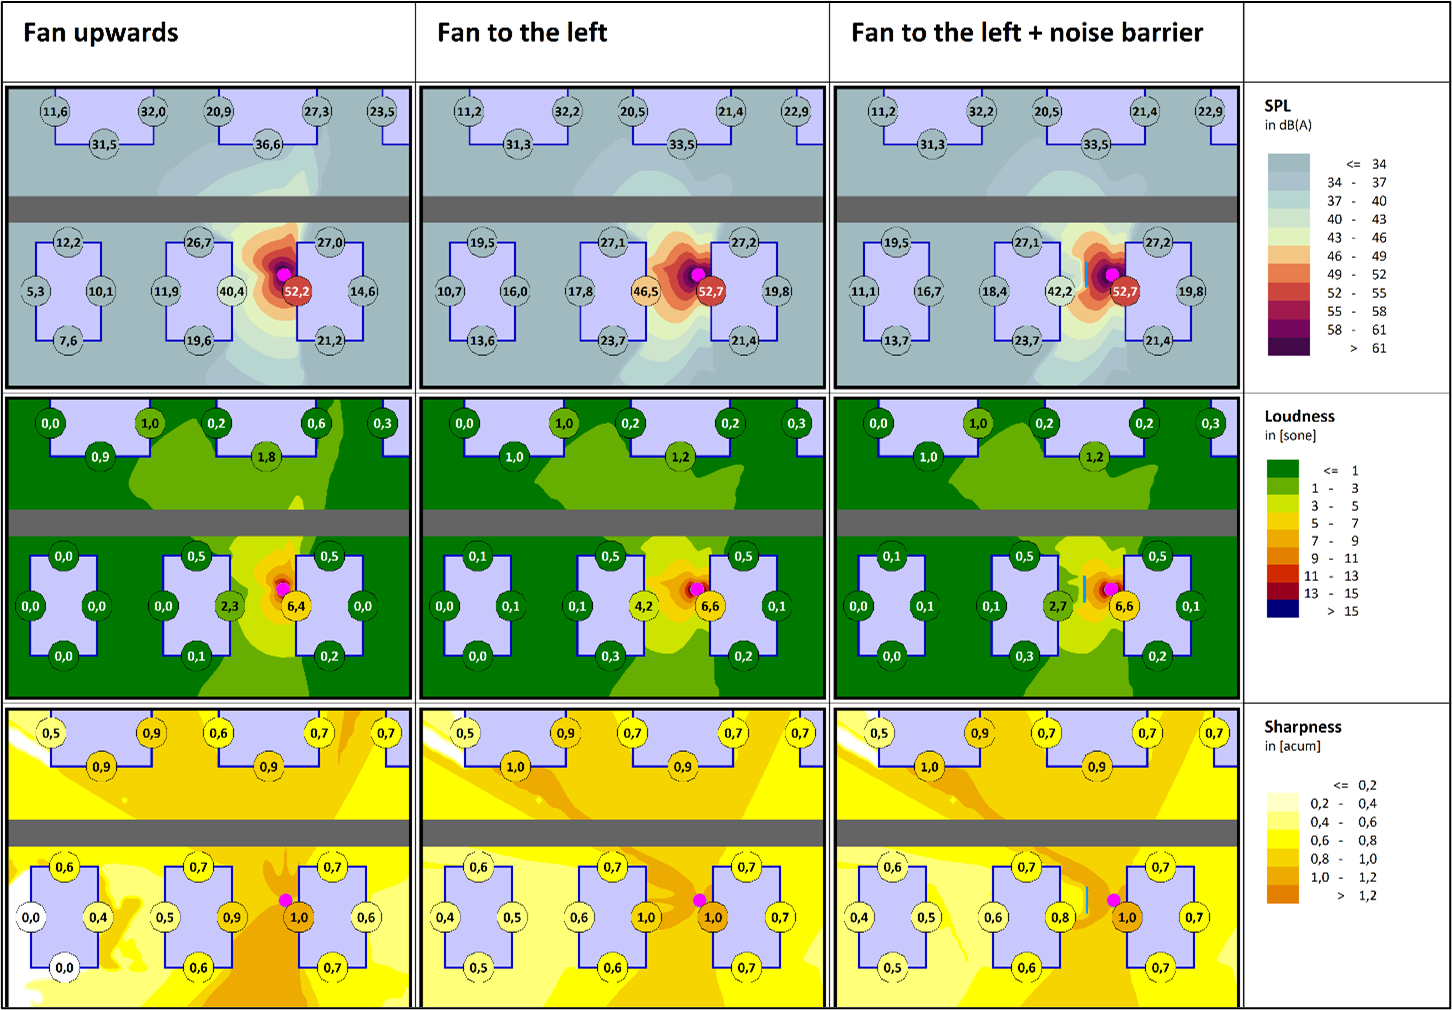
For each psychoacoustic evaluation parameter, the dependence on the distance away from the sound source must also be considered in a differentiated manner. Figure 1 clearly illustrates that the perceived sharpness (light green) of a sound hardly changes in relation to the distance from the sound source. A sound source is therefore also perceived as sharp at a greater distance, even if the A-weighted sound pressure level drops more significantly in comparison (black). This dependence can be confirmed with the calculation results from SoundPLANnoise®. Based on this, the psychoacoustic maps in Figure 2 clearly show the propagation of sound from a sound source in terms of sound pressure level (SPL), loudness and sharpness.
Project partners
SoundPLAN GmbH
[1] H. Fastl and E. Zwicker, “Psychoacoustics: Facts and models, 3rd Edition”, Springer, Berlin, New York, 2007.
[2] K. Genuit and A. Fiebig, “Psychoacoustics and its Benefit for the Soundscape Approach”, Acta Acustica united with Acustica, no. 1, pp. 952-958, 2006.


